
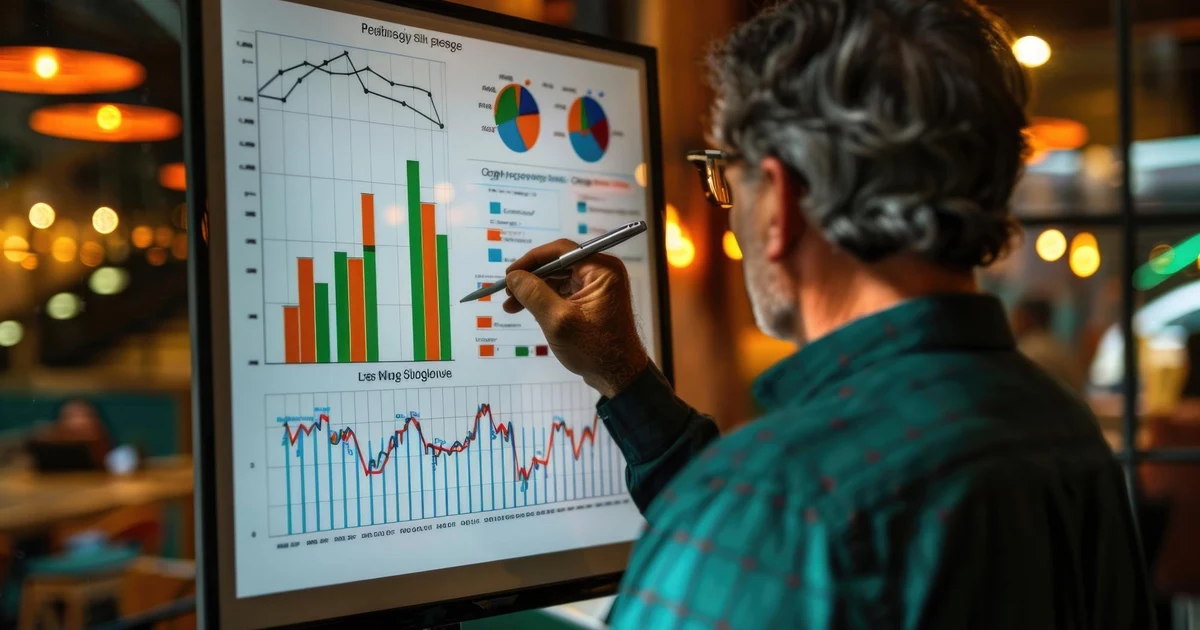
The S&P 500 gaps up at the open, the Nasdaq 100 reverses by lunch, and the DAX seems to ignore both. Anyone who trades indices has lived through days like this. A basic line chart rarely explains what is happening underneath. Index analysis rewards traders who read price, volume and volatility together. That is also why many serious traders look for the best indices broker, one that pairs competitive access to benchmark markets with charting tools deep enough to work with.
This guide walks through the methods that matter most and answers the questions traders ask most often.
Why Indices Need a Different Approach
An index isn’t a single company. It’s a weighted basket, so it moves on sector rotation, macro data and sentiment rather than one earnings report. The Nasdaq 100 leans heavily on mega-cap tech, while the Dow Jones, a price-weighted index of 30 stocks, can behave quite differently on the same day.
Good analysis starts with understanding how the benchmark is built and what drives it. Indices also trade in clear session rhythms: the Asian handoff, the London open, the New York cash open and the closing auction. Liquidity and volatility shift at each stage, and your charts should reflect that.
1. Multi-Timeframe Analysis
This is the foundation. Start on the daily or weekly chart to define the primary trend and mark major support and resistance. Drop to the 4-hour chart to find structure, such as swing highs, swing lows and consolidation ranges. Use the 15-minute or 5-minute chart only for timing entries. The rule of thumb is simple: trade in the direction of the higher timeframe unless there’s strong evidence of a shift. A bullish 15-minute setup inside a weekly downtrend deserves extra caution.
2. Volume Profile and VWAP
Price tells you where the market went. Volume tells you where it agreed. Volume Profile maps traded volume by price level, highlighting the Point of Control (POC) and the high-volume and low-volume nodes. Price tends to stall at high-volume nodes and move quickly through low-volume zones.
Pair this with the Volume Weighted Average Price (VWAP). Many institutional participants use VWAP as an execution benchmark, so index prices often react around it. A move above anchored VWAP from a key swing low, for instance, can signal buyers are still in control.
3. Ichimoku Cloud
Ichimoku packs trend, momentum and support and resistance into one view, making it useful when evaluating a best indices broker with reliable charting tools. The cloud (Kumo) shows dynamic zones, while the Tenkan-sen and Kijun-sen crossovers offer momentum clues. It works well on indices because they trend more smoothly than many single stocks. Treat a close above a thick cloud as stronger confirmation than one above a thin cloud, which is easier to break.
4. Fibonacci Retracements and Extensions
Fibonacci levels help frame pullbacks inside trends. The 38.2%, 50% and 61.8% retracements often line up with prior structure. The real edge comes from confluence: when a Fibonacci level overlaps with VWAP, a volume node or a prior swing high, the zone carries more weight. Use extensions, such as 127.2% and 161.8%, to map potential targets.
5. Volatility Tools: ATR and Bollinger Bands
Average True Range (ATR) measures how far an index typically moves, which makes it practical for stop placement and position sizing. A stop placed inside normal noise will get hit repeatedly. Setting it at 1.5 to 2 times ATR is a common starting point. Bollinger Bands show volatility expansion and contraction. A tight squeeze often comes before a larger move, though the band alone doesn’t predict direction. Combine it with structure and volume for context.
6. Momentum Divergence
When price makes a higher high but the Relative Strength Index (RSI) or MACD makes a lower high, momentum is weakening. This bearish divergence doesn’t guarantee a reversal, but it often warns that a trend is tiring. Divergence works best at key levels and on higher timeframes, where false signals are less common.
7. Intermarket and Breadth Analysis
Indices don’t move alone. Watch the US Dollar Index, Treasury yields, the VIX and crude oil. Rising yields can pressure growth-heavy indices like the Nasdaq. A spiking VIX often accompanies sharp selloffs in the S&P 500. Breadth adds another layer. If the index climbs while fewer stocks participate, as shown by a weak advance-decline line, the rally may be narrow and fragile.
8. Alternative Chart Types
Heikin-Ashi candles smooth noise and make trends easier to read. Renko charts filter out time entirely and focus on price movement. These are useful for spotting clean trends, though they can lag at turning points, so use them as a complement to standard candlesticks.
Common Mistakes to Avoid
- Stacking similar indicators: RSI, Stochastic and CCI all measure momentum. Using all three adds clutter, not insight.
- Ignoring the calendar: CPI prints, FOMC decisions and earnings from index heavyweights can override any pattern.
- Over-optimizing: A setup tuned perfectly to past data often fails live.
- Skipping risk management: Leverage magnifies gains and losses. Position sizing matters more than any indicator.
Putting It Into Practice
A sensible workflow looks like this: define the trend on the daily chart, mark key levels with Volume Profile and Fibonacci, check intermarket context, then use a lower timeframe to time the entry with a clearly defined stop. Test the process on a demo account before committing real capital.
Platform quality matters here. Baazex offers CFDs on major indices through its app, WebTrader and MT5, with real-time charts, alerts and zero commissions, so traders can apply these methods in one place. As with all leveraged products, CFDs carry a high risk of rapid losses.
Conclusion
Advanced charting isn’t about adding more indicators. It’s about combining a few reliable tools, like multi-timeframe structure, volume, volatility and intermarket context, into a repeatable process. That process helps you read what major indices are really doing and manage risk with discipline. Whichever methods you adopt, pair them with a reliable setup.
For traders comparing options, finding the best indices trading platform means looking at charting depth, execution quality, costs and transparency, not just flashy features. Baazex gives traders access to index CFDs through its app, WebTrader, and MT5, with real-time charts, alerts, and zero commissions, helping them apply advanced charting methods in a regulated environment.